Chapter Eight
Japanese Candle Chart
Candle chart (also called candlestick) analysis has been used since the 18th century by Japanese rice traders to predict the rice price’s movement. According to sources, a famous trader named Homma has discovered that studying market emotions could be useful to determine future trends and has developed the candlestick chart.
Although candle chart has only been introduced recently to Westerns traders, much thanks to the works of Gregory L. Morris and Steve Nison, the remarkable features of candle chart has gained a swift acceptance since the early 1990’s and the technique has been becoming one of the most commonly used chart analysis, especially to predict short-term movement of stock’s prices.
Candlestick Basic terms
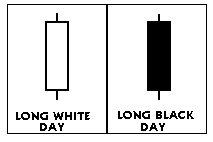
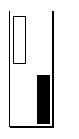
Real body. The Real Body is a bar made by the difference between the open and the close of the stock during the trading day. The body color is white when the stock closes higher and black when it closes lower than its opening.
Upper and lower shadows. Shadows of candlestick are the thin lines above and under the real body. The top of the upper shadow is the high of the day session and the bottom of the lower shadow is the low of the day session.
Special Candlesticks
Long day. A long day is a candlestick that has a large difference between its opening and closing prices, compared to the previous five to ten day sessions.
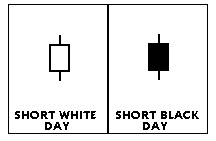
Short day. A short day is opposite of a long day. The difference between opening and closing prices is small, compared to the last five to ten day sessions.
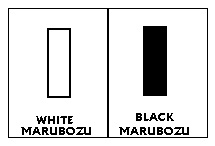
Marubozu. A candlestick that has no or little shadow or “wick” at both sides. A white Marubozu means that its open is the same as its low and its close is its high of the session. A black Marubozu means the opposite, the stock opens at its high and closes at its low of the session.
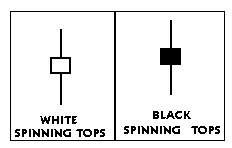
Spinning top. In this case, the body is very small with long upper and lower shadows.
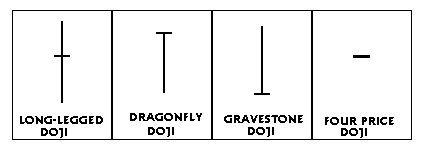
Doji. This is an extreme case of spinning stop where the body exists as a line, meaning that the day’s open and close are the same. A long-legged Doji has long upper and lower shadows, a gravestone Doji has long upper shadow but no lower shadow, a dragonfly Doji has a long lower shadow but no upper shadow, and a four price Doji has no body, no upper or lower shadows, illustrating the fact that the open, high, low and close are the same.
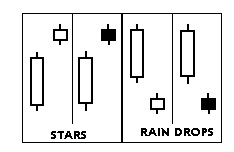
Star. A star has a small body, either black or white with short upper and lower shadows, and gaps above or below a long previous day candlestick.
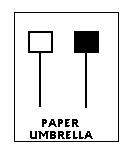
Umbrella and Inverted Umbrella. An umbrella is a dragonfly Doji (small body with a long lower shadow and no upper shadow) while an inverted umbrella is similar to a gravestone Doji (small body with a long upper shadow and no lower shadow). Appearing after many consecutive up or down sessions, the umbrella and inverted umbrella are strong sign of trend reversal.
Some basic patterns
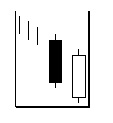
Engulfing Bullish
A long black day occurs after a downward trend and followed by a long white day that engulfs the previous day. This is a moderate bullish pattern that can be confirmed by a third white day and then becomes the Three Outside pattern, which is a strong bullish indicator.
Hammer Bullish

The pattern bears the image of a hammer with a small body, either black or white, and a low shadow at least twice the length of the body. The sell off occurs by a downtrend gap but the stock manages to close near its opening, signaling a weakening of the bearish sentiment. A confirmation on the next day is needed for a bullish trend reversal.
Piercing Line Bullish
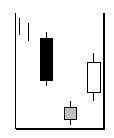
The first day is a long black day. The second day is a long white day that opens lower than the previous close but ends up above the midpoint of the previous black body. Following a downtrend, the stock gaps open lower but manages to finish higher than the midpoint of the previous body, suggesting an opportunity for bulls to enter the market and to reverse the trend.
Engulfing Bearish
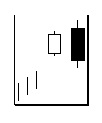
The opposite of Engulfing Bullish. The first day is a long white day and the second day is a longer black day that engulfs completely the previous day, suggesting that the bears may have gained strength. A confirmation on the third day is needed for a downtrend reversal.
Hanging Man Bearish

The pattern bears the image of a “hanging man” with a small body and a long lower shadow at least twice the size of the body. A confirmation on the next day is needed for a bearish sentiment.
Shooting Star or Gravestone Bearish
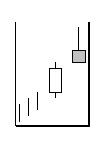
This pattern is similar to the Hanging Man but the shadow is an upper instead of a lower one. The shooting star occurs when the day has a body, although very small. When the open and the close are the same, the pattern becomes the Gravestone Bearish.
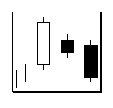
Harami Bearish
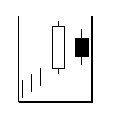
The first day is a long white day that follows an uptrend. The second day is a small black day that is completely inside the body of the previous white day. By itself, Harami Bearish is a low bearish signal but can be confirmed by the next day and becoming a strong trend reversal pattern such as the Three Inside Bearish.
Some bullish candlestick indicators with high reliability
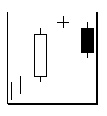
Abandoned Baby Bullish
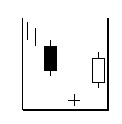
The first day is a long black day. The second day is a Doji that gaps below the close of the previous day and the third day is a white long day, gapping above the previous close and no overlapping shadows.
In a downtrend, the market sells off with a long black day and gaps open on the second day. However, because of lack of sellers, the market closes at or near its open. The third white day with upward gap at the open confirms the trend reversal to bullish.
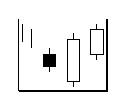
Concealing Baby Swallow Bullish
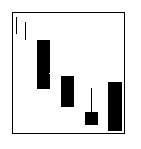
The first two days are Black Marubozu days. The third day is a black day that gaps downward and trades into the body of the previous day. The fourth day is a black Marubozu engulfing the third day.
The concealing Baby Swallow Bullish indicates that there will be no more sellers and short sellers will start to cover their positions. The market is ripe for a bullish reversal.
Kicking Bullish
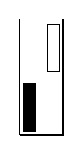
The first day is a Black Marubozu but the second day is a White Marubozu that gaps upward. This indicator is a very strong sign that the market is headed upward, no matter what was the trend before the signal. Kicking bullish appears usually after a very good news occurring after the previous day.
Mat Hold Bullish
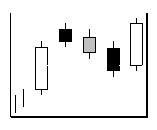
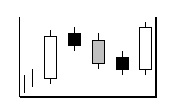
Mat Hold Bullish is a pattern of bullish continuation with high reliability. The first day is a long white day. The second day is a black day that gaps up. The second, third and fourth days have small bodies and follow a downtrend but within the range of the first day. The fifth day is a long white day that closes above the close of the first day.
The pattern shows that the bears have failed to reverse the uptrend and the bulls come in stronger to close at new high. The uptrend should continue for a while longer.
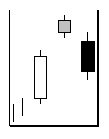
Morning Star Bullish
The first day is a long black day following a downtrend. The second day is a small day that gaps below the close of the previous day. The third day is a long white day. The pattern may be explained as a lack of sellers on the second day that closes at or near its open and shows the potential for a rally. The third white day is a confirmation of the rally.
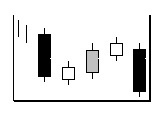
Rising Three Methods Bullish
The first day is a long white day, followed by three short days with small bodies either white or black, on a brief downtrend pattern but within the range of the first day. The fifth day is a long white day that closes above the first day’s close.
During an uptrend, a long white day occurs and the stock starts to lose steam. The short three-day downtrend is consistent with a take-profit period. The stock resumes its advance on the fifth day by a long white day and the bulls come in strong at a new high. The upward trend is likely to continue.
Side-by-Side White Lines Bullish
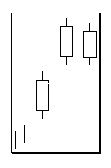
The first day is a long white day, the second day is also a long white day that gaps up, followed by a third long white day about the same size as the previous day. This pattern indicates that the bulls are always in charge and the uptrend momentum is building up strongly.
Three Inside Up Bullish
The first day is a long black day ending a downtrend. The second day is a short white day within the range of the previous long black day. The two-day event is also called a bullish Harami pattern. The third long white day, closing higher than the second day is a confirmation of the Harami pattern and of the bullish trend reversal.
Three Outside Up Bullish
The first day is a short black day ending a downtrend. The second day is a long white day engulfing the first day. The two-day pattern is also called a bullish engulfing pattern. The third long white day is a confirmation of the bullish engulfing pattern and of the bullish uptrend reversal.
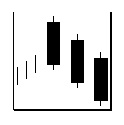
Three White Soldiers Bullish
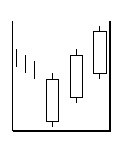
At the end of a downtrend, three long white days occur, each with a higher close than the previous day. Also, each day opens within the body of the previous day. The pattern has a high reliability of a bullish uptrend reversal. The bulls are coming back strong and are building on moderate upward steps.
Some bearish candlestick indicators with high reliability
Abandoned Baby Bearish
The first day is a long white day. The second day is a Doji that gaps up and the third day is a long black day that gaps down with no overlapping shadows.
The meaning of this pattern is that the bulls run out of steam and fail to sustain its advance on the second day. The third day is a confirmation of the trend reversal, validated by a downward gap and a lower close.
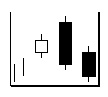
Dark Cloud Cover
The first day is a long white day following an uptrend. The second day is a black long day that opens higher than the previous close but ends up closing lower than the midpoint of the previous white body.
The pattern suggests that the bears are taking over and investors are starting to take profits, as well an opportunity for short sellers on the next day’s open.
Evening Doji Star Bearish
This pattern is somewhat similar to the Abandoned Baby Bearish with the difference that the shadows are overlapping. However the pattern has a high level of reliability and suggests that the bears are definitely in charge by the third black day. The Evening Doji Star Bearish is the confirmation of the bearish Doji Star pattern.
Evening Star Bearish
This is a three-day pattern similar to Abandoned Baby Bearish or Evening Doji Star Bearish. The only difference is that the second day has a small body instead of a Doji. The meaning is the same.
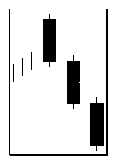
Falling Three Methods Bearish
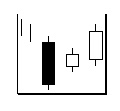
The first day is a long black day following a downtrend. The second, third and fourth day have small bodies that attempt to initiate a short uptrend but still within the range of the first black long day body. On the fifth day, the bears come in strong and the stock closes at its lowest point of the pattern. The downward trend should continue.
Identical Three Crows Bearish
Three consecutive long black days happen, each with an opening same as the close of the previous day and a close way below the previous day. This is a very strong indicator of a bearish trend, usually after the release of a bad news and no investor can fight such a bearish sentiment.
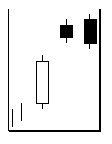
Kicking Bearish
The first day is a long white Marubozu following by a long black Marubozu that gaps downward. Kicking Bearish is a very strong indicator that the stock is headed downward, no matter which trend it was before. The pattern occurs usually after a negative event that catches investors by surprise and they cannot help but to sell and think later.
Three Black Crows Bearish
The pattern is similar to Identical Three Crows Bearish with the difference that the opening of the two last days is within the body of the previous day. The meaning is also pretty the same, suggesting that the stock has been at a high price for too long and investors are starting to take profits.
Three Inside Down Bearish
The first two days demonstrate a bearish Harami pattern with a small black second day within the long white first day. The third day is a black long day that closes lower than the first day and confirms the bearish trend reversal.
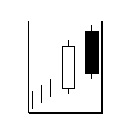
Three Outside Down Bearish
The first two days illustrate a bearish Engulfing pattern which composes of a first small white day and a second long black day that engulfs the first day. The third day is a long black day that closes lower than the first day. This confirms the bearish trend reversal.
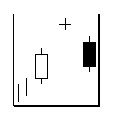
Upside Gap Two Crows Bearish
The first day is a long white day following an uptrend. The second day is a small black day that gaps upward and the third day is also a black day that engulfs the second day but still closes above the first day. This pattern suggests that the bears are trying to bid the stock down after a long upward trend and signals that the stock can no longer hold its position and ready for a ride down.